
Investing Business Modelling
Because, at the end of the day, it’s not just the size of returns and profits that matter but also who owns them.
The pricing of some financial strategies continues to remain obscure and extremely difficult to ascertain, despite regulators’ substantial efforts to improve transparency.
One recurring example is structured products. Usually the various economic outcomes at expiry of the vehicle are outlined using a misleading graph (where the reference index is shown as price-only while the structured note is shown on a ‘total return’ basis).
The pricing of private equity funds and, specifically, private equity funds-of-funds is another example and involves complicated elements such as preferred thresholds, catch-ups, fixed versus variable, calculation methods, deal closing fees and whatnot. It’s a little perplexing that the industry has not so far bothered to reach a consensus on how to present such facts, especially as the investment strategy has become more accessible to retail investors.
I wrote about this lack of transparency in a recent post (in Italian, here). Now I want to focus on magnitudes and attempt some calculations because, at the end of the day, it’s not just the size of returns and profits that matter but also who owns them. In the following simulations I will use the example of a three-layer structure (as in the Italian post). I have run two different cases: one where fees are paid every year and another where they are paid at the end of the fund-of-funds’ life. In both simulations the assumptions are
- Initial investment: $1,000,000, called 100% immediately;
- Fund’s life: 10 years;
- Gross annual compound return of underlying investments: 15% (or roughly 4x multiple);
- Layers:
- Local distributor (LD, usually via a ‘feeder fund’),
- Manager of managers (MM),
- Individual fund managers (FM);
- Fee assumptions (excluding sundry administrative, legal and auditing fees):
- LD 1.5% p.a. fixed on invested capital;
- MM 1.5% p.a. fixed on invested capital + 5% of profits;
- FM 1.5% p.a. fixed on invested capital + 20% of profits.
Figure 1 shows the results: on the left the case with annual fees and on the right the one with end-of-life fees (the ‘Compounding Effect’ is the impact of annual fee payments: as they come out, there is less capital to re-invest):
Figure 1
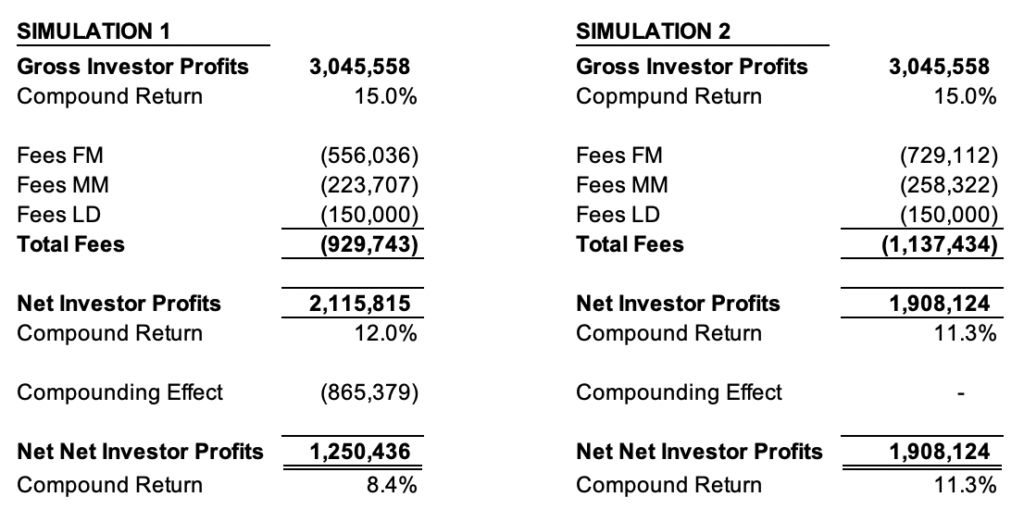
Too complicated? Depending how far you are willing to trust a back-of-the-envelope approach, a friend suggested this formula, which comes remarkably close to Simulation 1:
15.0% Gross return – 4.5% Fixed fees = 10.5% Net to investor – 25.0% Performance fees = 7.9% Net net to investor.
Summarizing, the 15% gross return becomes 7.9%, 8.4% or 11.3%, all three within striking distance of US equity nominal returns over the last 100+ years. Today you can ‘buy’ this equity return for 0.10% p.a. using the Vanguard Total Stock Market ETF, among other alternatives, with the added benefit of being able to sell at any time.
Two questions:
– Why don’t we see similar explanatory tables or formulas in fund-of-funds or any other private equity offerings?
– Is this really a good business model for the investor?
Roberto Plaja, August 13, 2020
Cover: Pablo Picasso, ‘Artist and His Model,’ 1926, https://www.wikiart.org/en/pablo-picasso/artist-and-his-model-1926